Betelgeuse Light Curve 2002-2012 Data
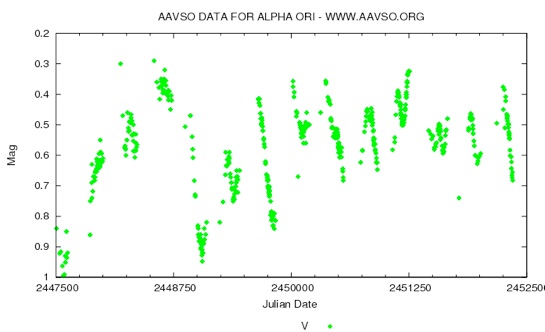
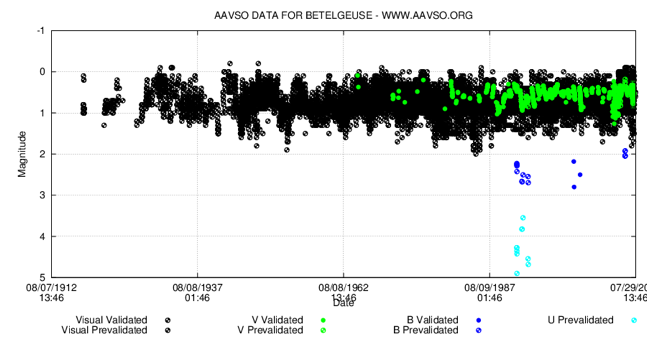
The upper graph (from AASVO generator) illustrates the bolometric and visual magnitude (both validated and pre-validated) of Betelgeuse from 1912 to 2012. The lower graph (from Wikipedia) illustrates the visual variable validated magnitude of Betelgeuse for a 13.5 year span.
The first (upper) graph above demonstrates a spotty, erratic and increasing bolometric emission pattern for about 50 years, with a 5 year period, where around 1980 the visible magnitude emerges and increases in magnitude amplitude, while the bolometric magnitude appears to decrease at its expense.
The second graph above demonstrates a variable, erratic and unstable visual luminosity emission from Betelgeuse over a 4.1 year cycle, suggesting a gravitational instability from within its internal structure or an external interference. The external influence could be from an orbiting body, such as another star or pulsar, causing perturbations. There are two visible modes, an alpha of period 1500 (225) days and a beta of period 375 (50) days, in this luminosity pattern, which I claim may create destructive interference, of one mode on the other, as evident in the inconsistent phases generated: phase 1 (233da), phase 2 (200 da), phase 3 (250da), and a phase 4 (200da).
Luminosity is directly proportional to radius and radius size is inversely proportional to the gravitational force exerted and required to keep the star together as an single entity. Note that the Hulse Taylor PSR 1913+16 evidenced a loss of gravitational energy that caused a decreasing change in period over many orbits in accord with Einstein’s modification of Newton’s equations. Hence, looking at the bottom graph above, this interference can be extrapolated to project, that if there is a 15% contraction in radius observed in 1992, and consequential change in gravitation energy, then there should develop a final and in a unrecoverable phase, when the slope of the net luminosity is extended. Therefore, it is projected that the final phase exit of photons produced by Betelgeuse could be in or about 2022-2026. The nuclear fuel deficit creates a pulse trigger on the radius, in which the temperature is thought to rapidly rise. Note however, there is a temperature deficit in Betelgeuse and between the zone of avoidance limit; his discrepancy may be too great for it to end as a supernova at all, and it could also go silently into the main sequence of stars.
Additionally, if the area under the smaller mode in the lower graph above is computed, summed and compared between the larger phases; a energy/magnitude deficit is noted. The actual star structure is gone at the point where the luminosity leaves the final stellar residue radius in 2012, but it likely will not be visible as a supernova until the final photons exit and the gravitational radius does not contract for another phase in 2022-2026.
Consequently, based on this data and evaluating the foregoing scientific parameters, on or about the year 2024, plus or minus 5 years, Betelgeuse is projected, by this author, Mary Ann Slaby, to become a supernova, visible from Earth. However, this event is not necessarily projected to be the next supernova event which could occur in the Universe or even locally.
-
1.AASVO, http://www.aavso.org/vsots_alphaori.
-
2.Gilster, Paul, in Centauri Dreams, The SN 1987A Experiment: (2011) The SN 1987A Experiment showing neutrinos may travel faster than light: http://www.centauri-dreams.org/?p=19912
-
3.Townes, C. H., Wishnow, E. H., Hale, D.D.S., and Walp, B. (2009) "A Systematic Change with Time in the Size of Betelgeuse", The Astrophysical Journal Letters 697 (2): L127–28. Bibcode 2009ApJ...697L.127T. doi:10.1088/0004-637X/697/2/L127.

